Pragma Core parses your source code and builds interactive call graphs that show how classes, functions, and method calls relate to each other. Overlay vulnerability findings directly on the graph to spot high-risk code paths instantly.
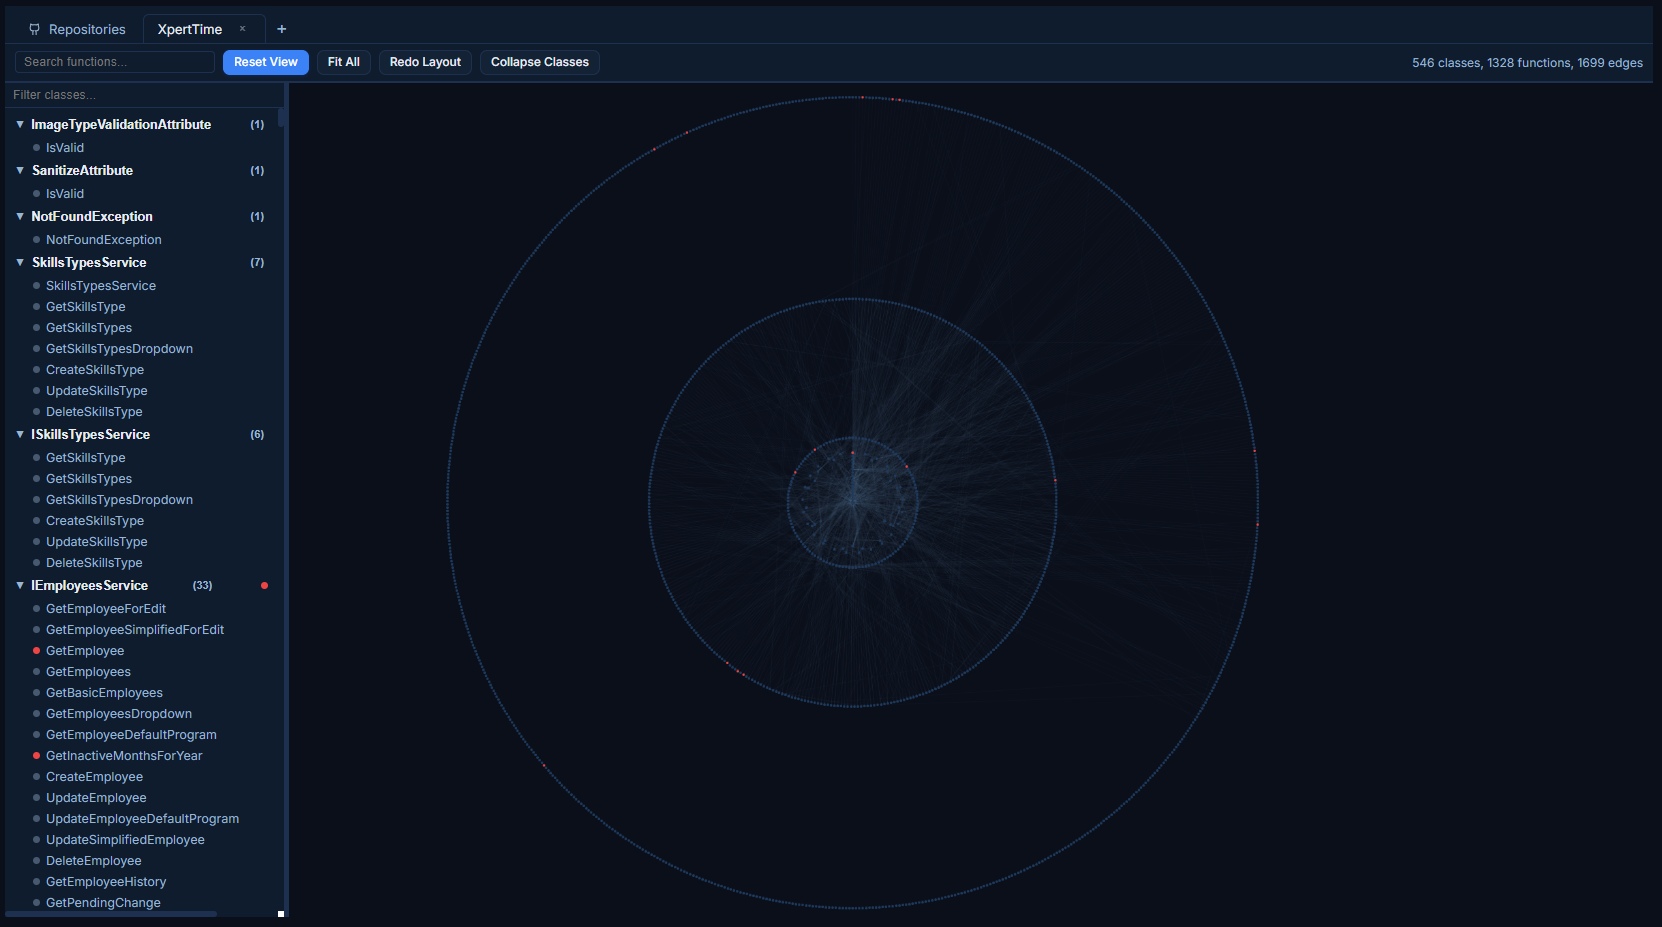
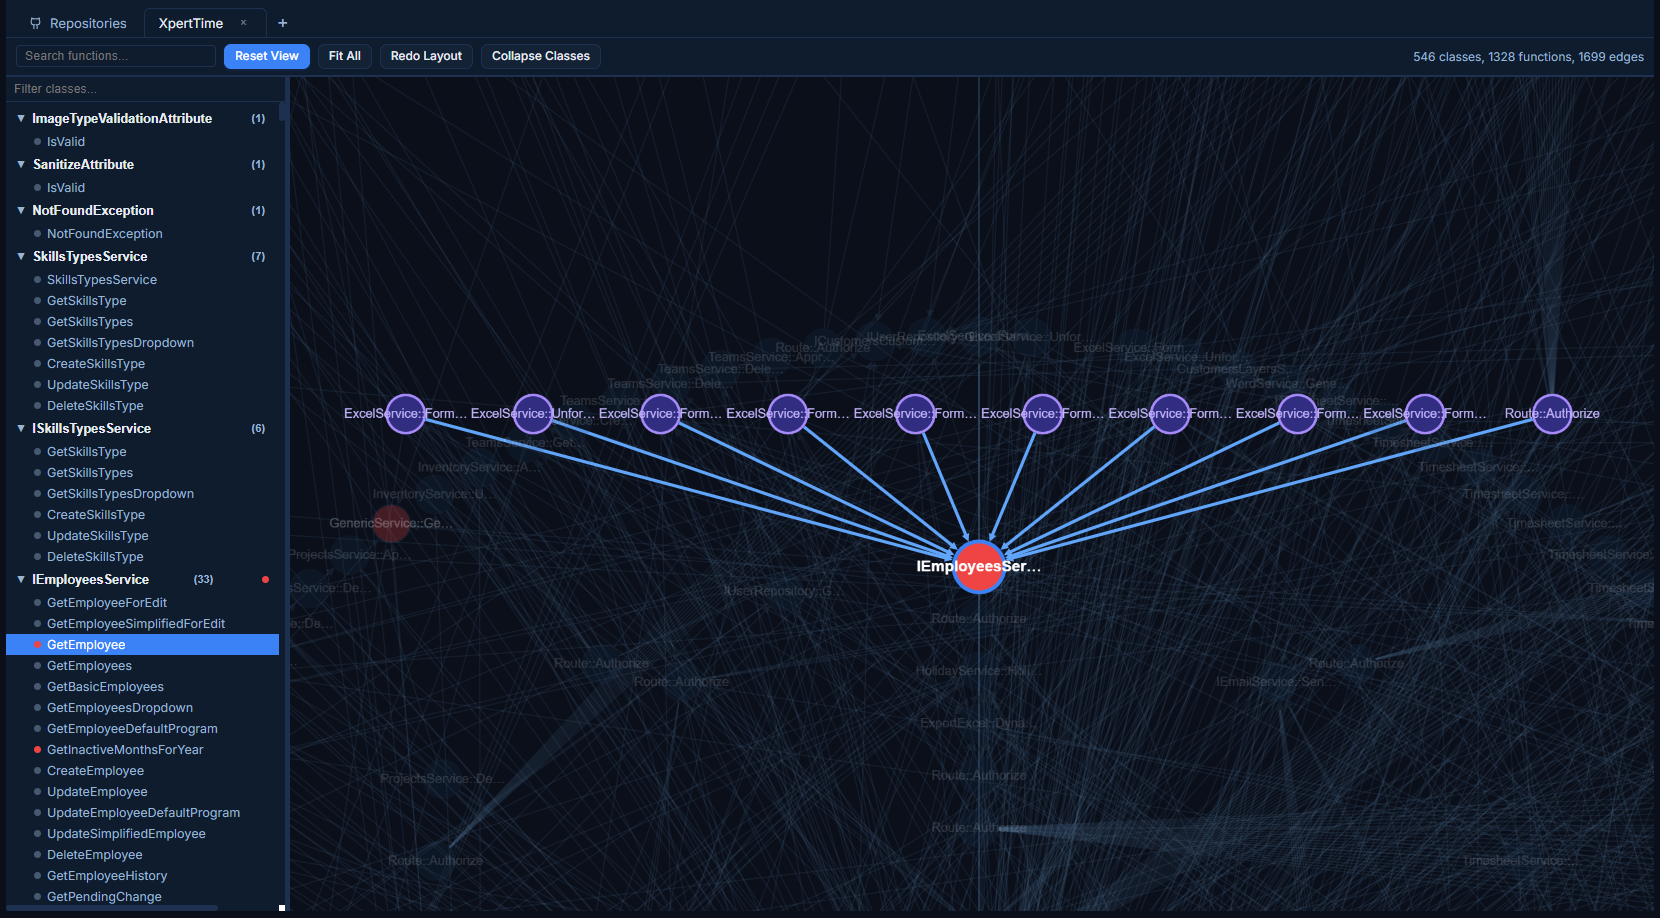
Interactive call graph with function nodes, class groups, and call edges
/ code-map / tree viewer
Click any function to view its call stack
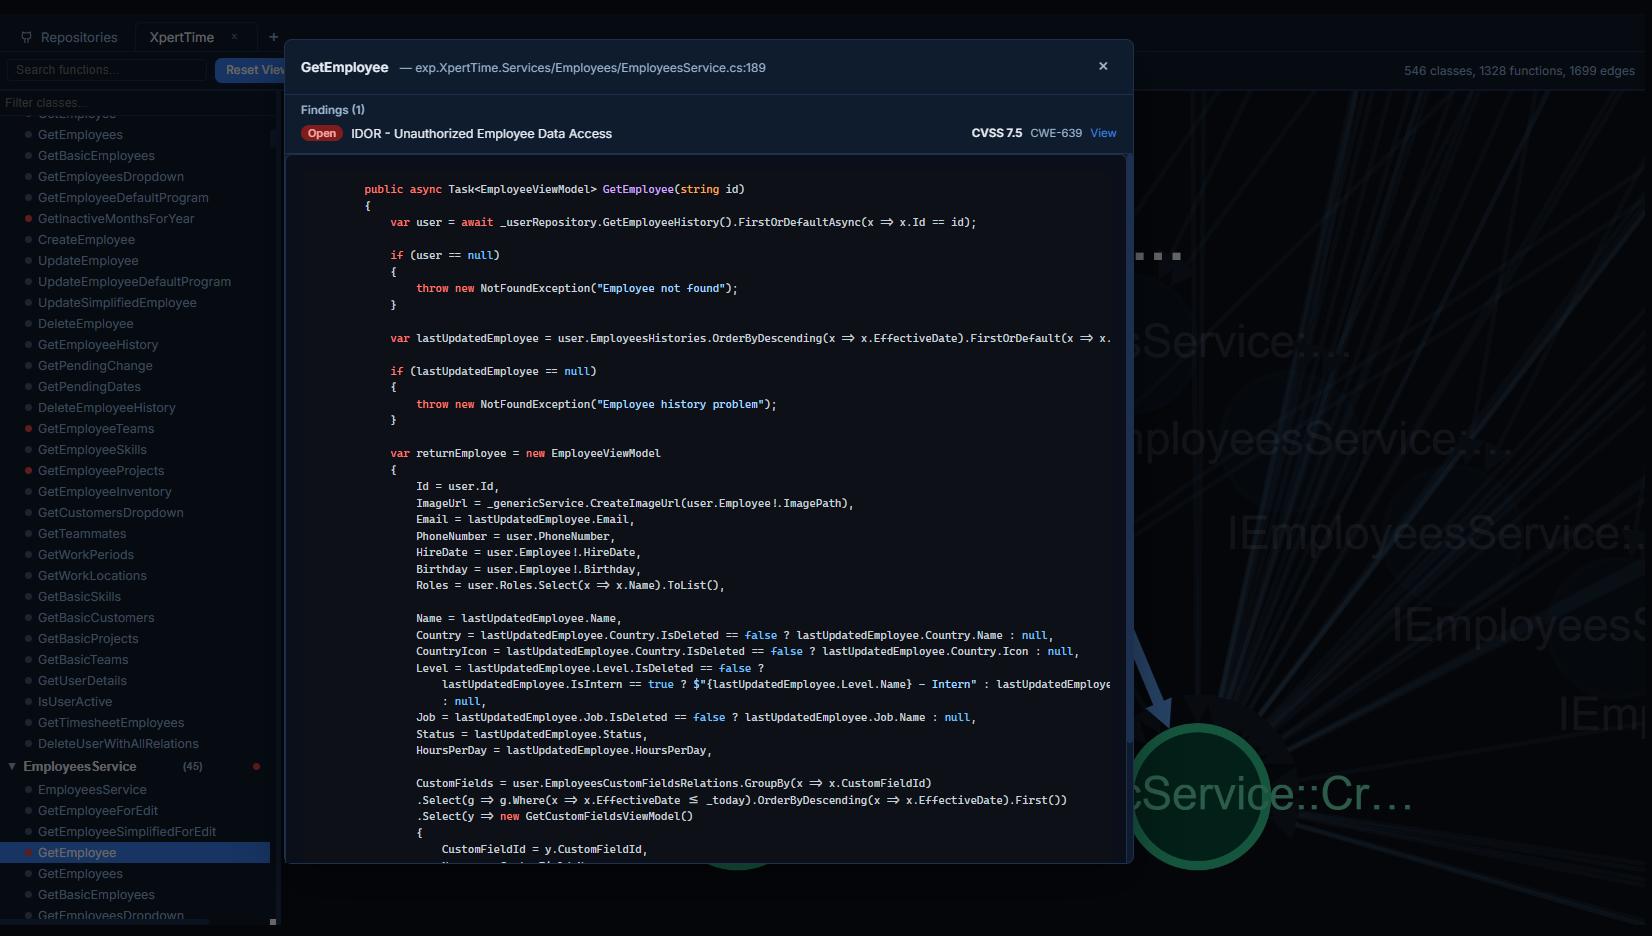
/ code-map / vulnerability overlay
Vulnerability overlays color-code nodes by finding status across the graph
How it works
From source code to interactive graph
Your code is parsed into an abstract syntax tree. The platform extracts classes, functions, and call relationships, then renders them as an interactive graph.
1
Trigger generation
Click generate on any cloned repository. The platform scans all source files and detects the programming language automatically.
2
AST parsing
Every file is parsed into an abstract syntax tree to extract classes, functions, methods, and call expressions with precise line-level positions.
3
Edge resolution
Function calls are resolved to their targets across files and classes. The result is a complete caller-to-callee graph of your codebase.
4
Interactive visualization
Explore the graph in your browser. Click any function to see its source code, filter by class, and identify vulnerable code paths through color-coded overlays.
Capabilities
More than a pretty diagram
Caller and callee tracing
Click any function node to highlight every function that calls it and every function it calls. Trace execution paths through your architecture in seconds.
Vulnerability overlays
SAST findings are mapped to function nodes and color-coded by status. Red for open vulnerabilities, orange for fixed, blue for false positives. See risk at a glance.
Inline source viewer
Click a function node to view its source code with syntax highlighting. Related findings are displayed alongside the code, with CVSS scores and direct links.
Search and filter
Search functions by name, filter by class, or collapse class groups to focus on the part of the architecture that matters to you right now.
Class hierarchy view
Functions are grouped by their parent class in a collapsible sidebar tree. Expand a class to see all its methods, or collapse everything to get a high-level overview.
14+ languages supported
PHP, JavaScript, TypeScript, Python, Java, C#, Go, Ruby, Rust, C, C++, Kotlin, Swift, and Scala. The same analysis pipeline works across your entire polyglot codebase.
Understand your codebase before you try to secure it
Prioritize findings by blast radius
A vulnerability in a function called by 30 other functions is more dangerous than one in an isolated helper. Code Map shows you the call chain so you can triage based on real impact.
Onboard new team members faster
Give new developers a visual map of how your application is structured. Instead of reading hundreds of files, they can navigate the call graph and understand the architecture in minutes.
Plan refactors with confidence
Before changing a function, see every caller and callee. Code Map gives you the dependency information you need to estimate the scope of a refactor before writing a single line.
Support security research and pentesting
Security researchers use call graphs to trace data flow from user input to sensitive operations. Code Map gives them the architectural context they need to find complex multi-step vulnerabilities.
Visualize your codebase architecture
Generate interactive call graphs for any repository and overlay vulnerability data on top.